带有图形和滑块的布局
import dash
import dash_core_components as dcc
import dash_html_components as html
from dash.dependencies import Input, Output
import plotly.express as px

import pandas as pd

df = pd.read_csv('https://raw.githubusercontent.com/plotly/datasets/master/gapminderDataFiveYear.csv')

app = dash.Dash(__name__)

app.layout = html.Div([
    dcc.Graph(id='graph-with-slider'),
    dcc.Slider(
        id='year-slider',
        min=df['year'].min(),
        max=df['year'].max(),
        value=df['year'].min(),
        marks={str(year): str(year) for year in df['year'].unique()},
        step=None
    )
])

@app.callback(
    Output('graph-with-slider', 'figure'),
    Input('year-slider', 'value'))
def update_figure(selected_year):
    filtered_df = df[df.year == selected_year]

    fig = px.scatter(filtered_df, x="gdpPercap", y="lifeExp",
                     size="pop", color="continent", hover_name="country",
                     log_x=True, size_max=55)

    fig.update_layout(transition_duration=500)

    return fig

if __name__ == '__main__':
    app.run_server(debug=True)
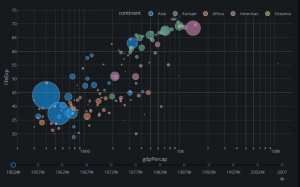
在这个例子中, 的"value"属性dcc.Slider是应用程序的输入,应用程序的输出是 的"figure"属性 dcc.Graph。每当value的dcc.Slider变化,短跑调用回调函数update_figure用新值。该函数使用这个新值过滤数据帧,构造一个figure对象,并将其返回给 Dash 应用程序。
这个例子中有一些不错的模式:
我们使用熊猫库的应用程序的启动加载我们的数据框: df = pd.read_csv('...')。此数据帧df处于应用程序的全局状态,可以在回调函数中读取。

将数据加载到内存中可能会很昂贵。通过在应用程序启动而不是在回调函数内部加载查询数据,我们确保此操作仅执行一次——当应用程序服务器启动时。当用户访问应用程序或与应用程序交互时,该数据 ( df) 已在内存中。如果可能,昂贵的初始化(如下载或查询数据)应该在应用程序的全局范围内完成,而不是在回调函数内完成。

回调不会修改原始数据,它只会通过使用 pandas 过滤来创建数据帧的副本。 这很重要: 您的回调不应修改其范围之外的变量。如果您的回调修改了全局状态,那么一个用户的会话可能会影响下一个用户的会话,并且当应用程序部署在多个进程或线程上时,这些修改将不会跨会话共享。

我们打开转换以layout.transition了解数据集如何随时间演变:转换允许图表从一个状态平滑地更新到下一个状态,就好像它是动画一样。
具有多个输入
在 Dash 中,任何“输出”都可以有多个“输入”组件。这是一个简单的示例,它将五个输入(value两个dcc.Dropdown组件的属性、两个dcc.RadioItems组件和一个dcc.Slider组件的属性)绑定到一个输出组件(组件的figure属性dcc.Graph)。请注意如何在.之后app.callback列出所有五个Input项目Output。
import dash
import dash_core_components as dcc
import dash_html_components as html
from dash.dependencies import Input, Output
import plotly.express as px

import pandas as pd

app = dash.Dash(__name__)

df = pd.read_csv('https://plotly.github.io/datasets/country_indicators.csv')

available_indicators = df['Indicator Name'].unique()

app.layout = html.Div([
    html.Div([

        html.Div([
            dcc.Dropdown(
                id='xaxis-column',
                options=[{'label': i, 'value': i} for i in available_indicators],
                value='Fertility rate, total (births per woman)'
            ),
            dcc.RadioItems(
                id='xaxis-type',
                options=[{'label': i, 'value': i} for i in ['Linear', 'Log']],
                value='Linear',
                labelStyle={'display': 'inline-block'}
            )
        ], style={'width': '48%', 'display': 'inline-block'}),

        html.Div([
            dcc.Dropdown(
                id='yaxis-column',
                options=[{'label': i, 'value': i} for i in available_indicators],
                value='Life expectancy at birth, total (years)'
            ),
            dcc.RadioItems(
                id='yaxis-type',
                options=[{'label': i, 'value': i} for i in ['Linear', 'Log']],
                value='Linear',
                labelStyle={'display': 'inline-block'}
            )
        ], style={'width': '48%', 'float': 'right', 'display': 'inline-block'})
    ]),

    dcc.Graph(id='indicator-graphic'),

    dcc.Slider(
        id='year--slider',
        min=df['Year'].min(),
        max=df['Year'].max(),
        value=df['Year'].max(),
        marks={str(year): str(year) for year in df['Year'].unique()},
        step=None
    )
])

@app.callback(
    Output('indicator-graphic', 'figure'),
    Input('xaxis-column', 'value'),
    Input('yaxis-column', 'value'),
    Input('xaxis-type', 'value'),
    Input('yaxis-type', 'value'),
    Input('year--slider', 'value'))
def update_graph(xaxis_column_name, yaxis_column_name,
                 xaxis_type, yaxis_type,
                 year_value):
    dff = df[df['Year'] == year_value]

    fig = px.scatter(x=dff[dff['Indicator Name'] == xaxis_column_name]['Value'],
                     y=dff[dff['Indicator Name'] == yaxis_column_name]['Value'],
                     hover_name=dff[dff['Indicator Name'] == yaxis_column_name]['Country Name'])

    fig.update_layout(margin={'l': 40, 'b': 40, 't': 10, 'r': 0}, hovermode='closest')

    fig.update_xaxes(title=xaxis_column_name,
                     type='linear' if xaxis_type == 'Linear' else 'log')

    fig.update_yaxes(title=yaxis_column_name,
                     type='linear' if yaxis_type == 'Linear' else 'log')

    return fig

if __name__ == '__main__':
    app.run_server(debug=True)
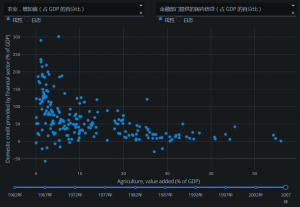
在此示例中,只要、 或组件中value的任何一个的属性 发生更改dcc.Dropdown,就会执行回调。dcc.Sliderdcc.RadioItems
回调的输入参数是每个“输入”属性的当前值,按照它们被指定的顺序。
即使一次只有一个Input更改(即用户只能在给定时刻更改单个 Dropdown 的值),Dash 也会收集所有指定Input属性的当前状态并将它们传递给回调函数。这些回调函数始终保证接收应用程序的更新状态。
让我们扩展我们的示例以包含多个输出。
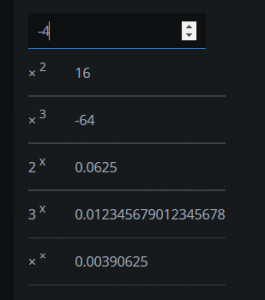
具有多个输出
到目前为止,我们编写的所有回调都只更新一个Output属性。我们还可以一次更新多个输出:列出您要在 中更新的所有属性app.callback,并从回调中返回那么多项目。如果两个输出依赖于相同的计算密集型中间结果,例如缓慢的数据库查询,这将特别有用
import dash
import dash_core_components as dcc
import dash_html_components as html
from dash.dependencies import Input, Output

external_stylesheets = ['https://codepen.io/chriddyp/pen/bWLwgP.css']

app = dash.Dash(__name__, external_stylesheets=external_stylesheets)

app.layout = html.Div([
    dcc.Input(
        id='num-multi',
        type='number',
        value=5
    ),
    html.Table([
        html.Tr([html.Td(['x', html.Sup(2)]), html.Td(id='square')]),
        html.Tr([html.Td(['x', html.Sup(3)]), html.Td(id='cube')]),
        html.Tr([html.Td([2, html.Sup('x')]), html.Td(id='twos')]),
        html.Tr([html.Td([3, html.Sup('x')]), html.Td(id='threes')]),
        html.Tr([html.Td(['x', html.Sup('x')]), html.Td(id='x^x')]),
    ]),
])

@app.callback(
    Output('square', 'children'),
    Output('cube', 'children'),
    Output('twos', 'children'),
    Output('threes', 'children'),
    Output('x^x', 'children'),
    Input('num-multi', 'value'))
def callback_a(x):
    return x**2, x**3, 2**x, 3**x, x**x

if __name__ == '__main__':
    app.run_server(debug=True)

 微信扫一扫,打赏作者吧~